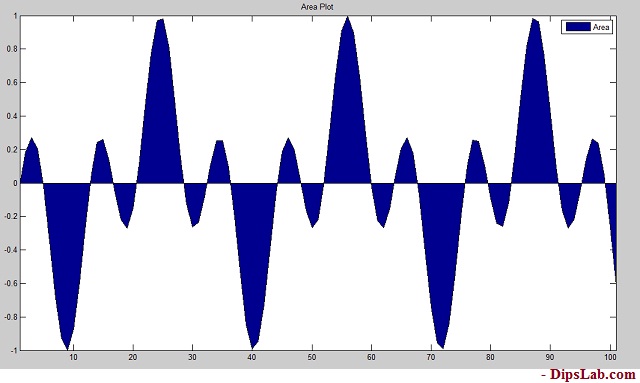
Syntax: The syntax for the Area plot…
area(x)MATLAB Code: As an example, we are plotting Area graph for trigonometric function. It is one of the types of functions in MATLAB.
% To create the area plot for the given equation Sin(t)Cos(2t).

% Enter the value of range of variable 't'.
t=[0:0.2:20];
% Put the given equation
a=[sin(t).*cos(2.*t)];
area(a)
title('Area Plot')
Note:
- ‘%’ is used to add the comment. The line starts with ‘%’ will get executed.
- ‘;’ semicolon is used to suppress the entered value.
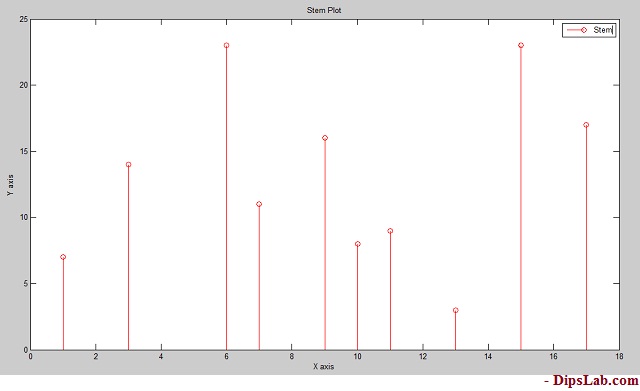
2. Stem Plot
In Stem plot, the discrete sequence data and variables are used. This plot is created by using the stem() function. How to create the Stem plot in MATLAB? Syntax: The syntax for the stem plot is,stem(x) stem(x, y) stem(----,'colour') stem(----,'width') stem(----,'style')MATLAB Code: Here we are creating the stem plot using the MATLAB functions for array of some random discrete numbers.
% Consisder the variable range of 'x' and 'y',
x=[3 1 6 7 10 9 11 13 15 17];
y=[14 7 23 11 8 16 9 3 23 17];
stem(x,y,'r')
title('Stem Plot')
xlabel('X axis')
ylabel('Y axis')
In this program, I used the color function (red ‘r’) and stem plot function (stem).
To decorate your graph, you can learn more about color markers and line specifiers in MATLAB.
Output in MATLAB:
You can see the 2-dimensional stem plot in MATLAB.