Get Help with Statistical Treatment of Data in Research
Statistical treatment of data is the application of mathematical and analytical techniques to a set of raw data to derive meaningful insights. It mainly involves
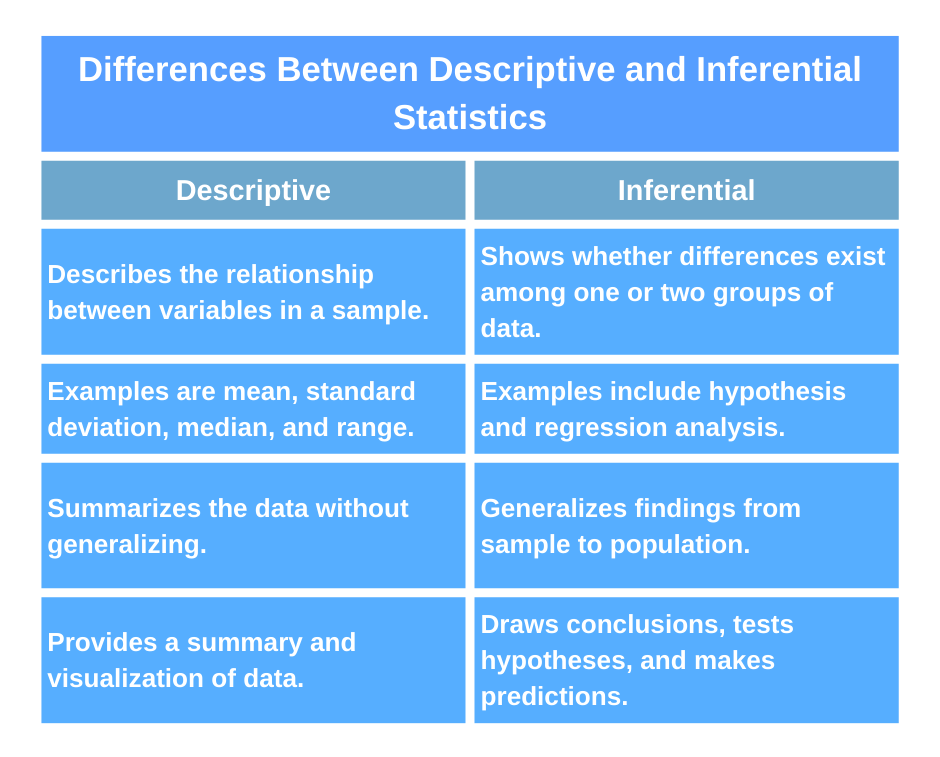
descriptive statistics that summarize data by describing the relationship between variables in a sample/population and inferential statistics that illustrate whether differences exist among one or two groups of data. Examples of descriptive statistics include mean, standard deviation, median, and range, while inferential statistics include hypothesis testing and regression analysis.
If you are in search of experts to conduct statistical treatment, our professionals apply analytical techniques to raw data to derive meaningful insights used for decision-making. Additionally, this article is a guide to statistical treatment, illustrating its methods, how to write, an example of an application in research, and the types of data.
Methods of Statistical Treatment
(1). Descriptive statistics
Descriptive statistics are used to summarize data in an organized manner by illustrating the relationship between variables in a sample/population. They enable the researcher to make sense of the data set. Categories of descriptive statistics are mean and standard deviation.
The mean describes the central tendency of the data. Finding the mean allows the researcher to characterize observations in a sample. The standard deviation is used to measure the
variability in a set of data. Below are the equations used to calculate both the mean,
x , and standard deviation,
s, assuming the number of measurements is
n.
x=x1 +x2 +...xn⁄ n
S= √∑(Xi -µ)2⁄n
(2). Regression analysis
Regression analysis is a
statistical analysis method where the researcher identifies the relationship between the dependent and independent variables in a data set. The researcher develops an equation that illustrates the changes in the dependent variable depending on the independent variable. A common form of this technique is linear regression which is further divided into simple and multiple linear regression. Below are the equations for each:
Simple-Υ= a + b
Χ +
u
Multiple- a+b
1X1 + b
2X2 +.....b
tXt +
u
In these equations:
Y is the dependent variable
X is the independent variable
a is the y-intercept
b is the slope of the explanatory variable
U is the error
(3). Testing hypothesis
Hypothesis testing is another method of statistical treatment that assesses assumptions of a population according to the statistics retrieved from a sample of a data set. Methods commonly used by researchers for this method are such as t-tests, Analysis of Variance [ANOVA], and the chi-square method.
It is important because it ensures quality assurance in a data set by eliminating errors such as type I and type II errors.
(4). Calculating sample sizes
When calculating sample sizes, the researcher finds the least number of observations that are needed to find the effects of a particular sample size. Calculating the sample size enables the researcher to get quality research results.
