
Introduction
In order to determine whether there is any association between dietary fibre and factors (such as health outcomes, age, gender, BMI, Education Level, income, Economic, Physical, Psychological, Good appetite, Biological, Social, Other factors affect food choice, People live with and Retire aged, various statistical analyses were performed. Firstly, descriptive and frequency analysis was performed on the demographic data. Then, Pearson’s correlation and ANOVA was performed to determine whether there is any association between the dependent variable, that is, Fiber and various independent variables (factors), which may be relevant for those seeking statistics dissertation help.Descriptive Statistics

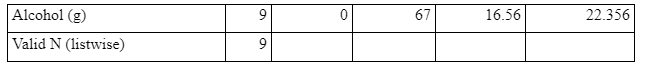 As per the above table, the mean age of participants was 71.41 years (SD = 4.42) with a mean weight of 75.78 Kgs (SD = 14.55), mean height of 166.33 cms (SD = 8.33), mean BMI of 27.11 (SD = 6.0), and mean retired age of 62.44 years (SD = 4.47). The average intake of energy of the participant was 1979.22 Kcal (SD = 529.49), Target was 1735 Kcal (SD = 334.60), Carbohydrate was 235.44 g (SD = 73.01), starch was 111.56 g (SD = 44.31), fiber was 26.22 g (SD = 8.27), Target_A was 30 g (SD = 0.00), sugar was 121 g (SD = 42.05), protein was 79.89 g (SD = 19.17), fat was 67.33 g (SD = 18.33), water was 2250.2 g (SD = 1221.29), and alcohol was 16.56 g (SD = 22.35).
Frequency Analysis
 As per frequency analysis, 11.1% (n = 1) of the participants had no children, and 88.9% (n = 8) of the participants had children.


 As per frequency analysis, 11.1% (n = 1) of the participant was divorced, and 88.9% (n = 8) of the participants were married.

 As per frequency analysis, 11.1% (n = 1) participant had 0-Level education, 33.3% (n = 3) participants had A-Level education and 55.6% (n = 5) had vocational education.

 As per frequency analysis, 11.1% (n = 1) participant preferred not to disclose monthly income, 33.3% (n = 3) participants had monthly income between 1500 and 200 and 44.4% (n = 4) had monthly income of more than 2000.

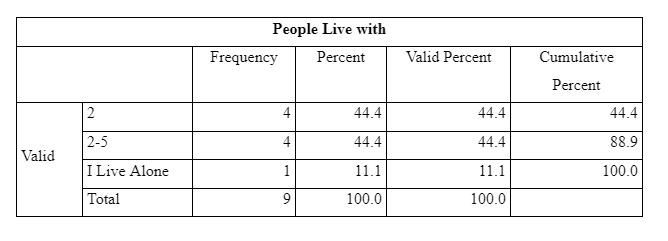 As per frequency analysis, 44.4% (n = 4) participants live with 2 people, and a similar number of participants live with 2-5 people. Only 11.1% (n = 1) participant revealed living alone.


 As per frequency analysis, 22.2% (n = 2) participants has heart disease and stomach problems, 11.1% (n = 1) participant had vit D and Calcium deficiencies, 11.1% (n = 1) participant had stomach problems and depressive disorder, 11.1% (n = 1) participant had type 2 diabetes, prostatic gyperplasia, heart disease and weight gain, and 11.1% (n = 1) participant had only heart disease.
Take a deeper dive into Public Perspectives on Legal and Social Values with our additional resources.
As per frequency analysis, 22.2% (n = 2) participants has heart disease and stomach problems, 11.1% (n = 1) participant had vit D and Calcium deficiencies, 11.1% (n = 1) participant had stomach problems and depressive disorder, 11.1% (n = 1) participant had type 2 diabetes, prostatic gyperplasia, heart disease and weight gain, and 11.1% (n = 1) participant had only heart disease.
Take a deeper dive into Public Perspectives on Legal and Social Values with our additional resources.

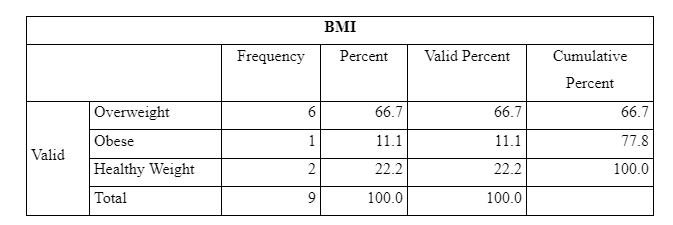 As per frequency analysis, 66.7& (n = 6) participants were overweight, 22.2% (n = 2) participants had healthy weight and 11.1% (n = 1) were obese

 In response to economic factors affecting food choice, frequency analysis shows that 44.4% (n = 4) selected cost and availability, 33.3% (n = 3) selected availability and 22.2 (n = 2) selected cost, income and availability.


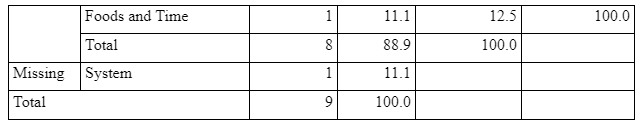 In response to physical factors affecting food choice, frequency analysis shows that 33.3% (n = 3) selected foods, 22.2% (n = 2) selected foods, skills and time and 11.1 (n = 1) selected skills and time, foods and skills, and foods and time.


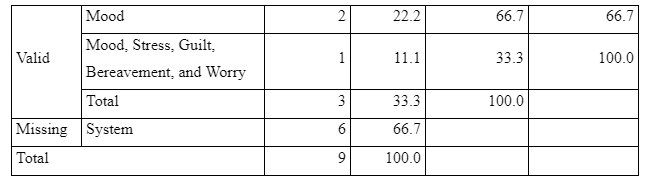 In response to psychological factors affecting food choice, frequency analysis shows that 22.2% (n = 2) selected mood and 11.1% (n = 1) selected mood, stress, guilt, bereavement, and worry.


 In response to good appetite affecting food choice, frequency analysis shows that 88.9% (n = 8) said yes good appetite affects food choice, while only 11.1% (n = 1) said good appetite does not affect food choice.


 In response to biological factors affecting food choice, frequency analysis shows that 55.6% (n = 5) selected regular meals, while 44.4% (n = 4) selected regular meals-driven by choice.


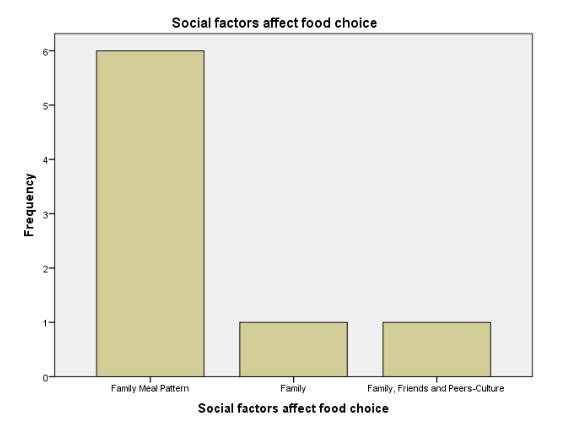
 In response to social factors affecting food choice, frequency analysis shows that 66.7% (n = 6) selected family meal pattern, 11.1% (n = 1) selected family and 11.1 (n = 1) selected family, friends and peers-culture.
 In response to other factors affecting food choice, frequency analysis shows that 77.8% (n = 7) selected knowledge of food and nutrition, 11.1% (n = 1) selected knowledge of food and nutrition and attitude, and 11.1 (n = 1) selected others.

Association between Dietary Fiber and Health Outcome
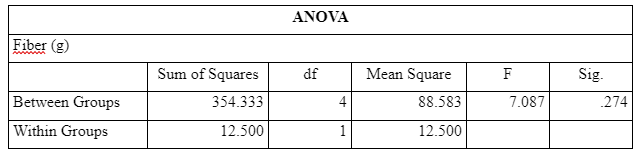
 As per ANOVA, F (4,1) = 7.08; p = .247. Since the p-value or the significance value is coming out to be .274, which is greater than the critical alpha value of 0.05, so there is no statistically significant association between dietary fiber and health outcome.
Association between Dietary Fiber and Age
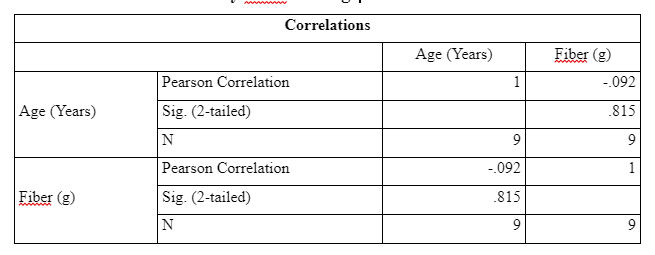 As per Pearson correlation, the correlation coefficient (r) = -.092; p = .815. A negative r shows that there is a negative association between age and fiber. That is, higher the age, lower will be the fiber intake and vice-versa. However, the p-value or the significance value is coming out to be .815, which is greater than the critical alpha value of 0.05. It shows that the above negative relationship is not statistically significant.
Association between Dietary Fiber and BMI

 As per ANOVA, F (2,6) = 0.638; p = .561. Since the p-value or the significance value is coming out to be .561, which is greater than the critical alpha value of 0.05, so there is no statistically significant association between dietary fiber and BMI.
Association between Dietary Fiber and Education Level
 As per ANOVA, F (2,6) = 1.446; p = .307. Since the p-value or the significance value is coming out to be .307, which is greater than the critical alpha value of 0.05, so there is no statistically significant association between dietary fiber and education level.
Association between Dietary Fiber and Income
 As per ANOVA, F (2,5) = 2.836; p = .150. Since the p-value or the significance value is coming out to be .150, which is greater than the critical alpha value of 0.05, so there is no statistically significant association between dietary fiber and income.
Association between Dietary Fiber and People Live With
 As per ANOVA, F (2,6) = 3.65; p = .092. Since the p-value or the significance value is coming out to be .092, which is greater than the critical alpha value of 0.05, so there is no statistically significant association between dietary fiber and people live with.
Association between Dietary Fiber and Retired Age
 As per Pearson correlation, the correlation coefficient (r) = -.226; p = .559. A negative r shows that there is a negative association between retirement age and fiber. That is, higher the retirement age, lower will be the fiber intake and vice-versa. However, the p-value or the significance value is coming out to be .559, which is greater than the critical alpha value of 0.05. It shows that the above negative relationship is not statistically significant.
Association between Dietary Fiber and Weight
 As per Pearson correlation, the correlation coefficient (r) = -.436; p = .240. A negative r shows that there is a negative association between weight and fiber. That is, the higher the weight; lower will be the fiber intake and vice-versa. However, the p-value or the significance value is coming out to be .240, which is greater than the critical alpha value of 0.05. It shows that the above negative relationship is not statistically significant.
Association between Dietary Fiber and Height
 As per Pearson correlation, the correlation coefficient (r) = -.215; p = .578. A negative r shows that there is a negative association between height and fiber. That is, the higher the height; lower will be the fiber intake and vice-versa. However, the p-value or the significance value is coming out to be .578, which is greater than the critical alpha value of 0.05. It shows that the above negative relationship is not statistically significant.
Association between Dietary Fiber and Economic Factor
 As per ANOVA, F (2,6) = 0.973; p = .430. Since the p-value or the significance value is coming out to be .040, which is less than the critical alpha value of 0.05, so there is statistically significant association between dietary fiber and economic factor.
Association between Dietary Fiber and Physical Factor
 As per ANOVA, F (4,3) = 1.362; p = .416. Since the p-value or the significance value is coming out to be .416, which is greater than the critical alpha value of 0.05, so there is no statistically significant association between dietary fiber and physical factor.
Association between Dietary Fiber and Psychological Factor
 As per ANOVA, F (1,1) = 0.120; p = .788. Since the p-value or the significance value is coming out to be .788, which is greater than the critical alpha value of 0.05, so there is no statistically significant association between dietary fiber and psychological factor.
Association between Dietary Fiber and Good Appetite
 As per ANOVA, F (1,7) = 1.482; p = .263. Since the p-value or the significance value is coming out to be .263, which is greater than the critical alpha value of 0.05, so there is no statistically significant association between dietary fiber and good appetite.
Association between Dietary Fiber and Biological Factor

 As per ANOVA, F (1,7) = 3.002; p = .127. Since the p-value or the significance value is coming out to be .127, which is greater than the critical alpha value of 0.05, so there is no statistically significant association between dietary fiber and biological factor.
Association between Dietary Fiber and Social Factor
 As per ANOVA, F (2,5) = 0.583; p = .592. Since the p-value or the significance value is coming out to be .592, which is greater than the critical alpha value of 0.05, so there is no statistically significant association between dietary fiber and social factor.

Association between Dietary Fiber and Other Factors
 As per ANOVA, F (2,6) = 0.639; p = .560. Since the p-value or the significance value is coming out to be .560, which is greater than the critical alpha value of 0.05, so there is no statistically significant association between dietary fiber and other factor.
Comparing Fiber content between age less than and more than 30
 The mean for fiber intake for <30g was 21.50g (SD = 4.76) and for >30g was 35.67g (SD = 4.04).
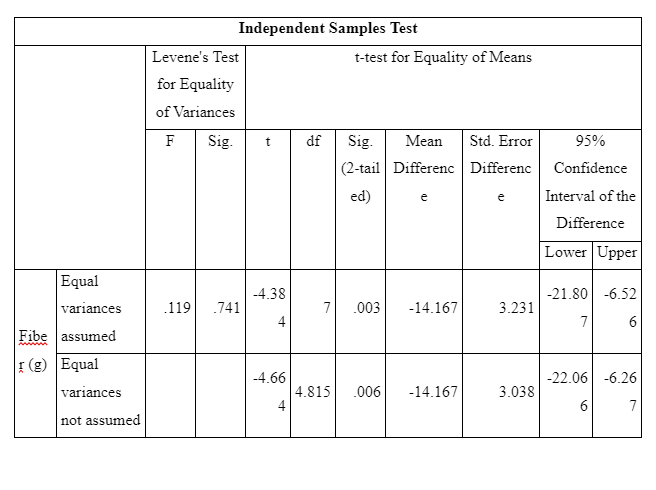 As per independent t-test, t(7) = -4.34; p = 0.003. As p-value is less than critical alpha value of 0.05, it shows there is significant difference in mean fiber intake between the two groups. The mean fiber intake of group >30g was statistically significantly higher among elderly people as compared to <30g.
Association between Fiber Content and Iodine
 As per Pearson’s correlation, (r) = -0.146; p = 0.754. This shows that there is negative relationship between fiber and iodine which is not significant.
Dig deeper into Self-Esteem and Body Shape Concerns in Society with our selection of articles.
As per Pearson’s correlation, (r) = -0.146; p = 0.754. This shows that there is negative relationship between fiber and iodine which is not significant.
Dig deeper into Self-Esteem and Body Shape Concerns in Society with our selection of articles.


What Makes Us Unique
- 24/7 Customer Support
- 100% Customer Satisfaction
- No Privacy Violation
- Quick Services
- Subject Experts
Dissertation Samples
Assignment/Essay Samples
Research Proposal Samples
Academic services materialise with the utmost challenges when it comes to solving the writing. As it comprises invaluable time with significant searches, this is the main reason why individuals look for the Assignment Help team to get done with their tasks easily. This platform works as a lifesaver for those who lack knowledge in evaluating the research study, infusing with our Dissertation Help writers outlooks the need to frame the writing with adequate sources easily and fluently. Be the augment is standardised for any by emphasising the study based on relative approaches with the Thesis Help, the group navigates the process smoothly. Hence, the writers of the Essay Help team offer significant guidance on formatting the research questions with relevant argumentation that eases the research quickly and efficiently.
DISCLAIMER : The assignment help samples available on website are for review and are representative of the exceptional work provided by our assignment writers. These samples are intended to highlight and demonstrate the high level of proficiency and expertise exhibited by our assignment writers in crafting quality assignments. Feel free to use our assignment samples as a guiding resource to enhance your learning.